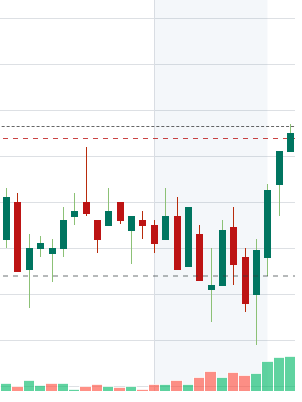
If you’ve ever heard someone say:
“The chart looks bullish, so the stock will go up!”
That’s technical analysis in action.
In this guide, you’ll learn what technical analysis is, how it works, and how beginners can use it to understand stock price movements.

🧠 Definition: What Is Technical Analysis?
In simple terms:
“Technical analysis is predicting future price movements by studying past price and volume data (charts).”
Unlike fundamental analysis (which studies earnings, industries, and valuation), technical analysis looks only at price and trading activity to guide investment decisions.
🔍 Common Tools in Technical Analysis
Here are the most popular tools traders use:
1. 📊 Candlestick Charts
- Show open, close, high, and low prices.
- Green/White (Bullish candle): Price went up
- Red/Black (Bearish candle): Price went down
2. 📈 Moving Averages (MA)
- Lines showing average prices over time (e.g., 20-day, 50-day, 200-day).
- Help identify the overall trend direction.
3. 📊 Volume
- Rising price + rising volume = stronger signal.
- Falling price + high volume = potential trend reversal.
4. 📉 Support & Resistance
- Support: Price level where buyers often step in (floor).
- Resistance: Price level where sellers take profits (ceiling).
5. 📊 Indicators (MACD, RSI, etc.)
- MACD: Momentum and trend strength
- RSI: Overbought (>70) or oversold (<30) signals
⚖️ Technical vs. Fundamental Analysis
| Feature | Fundamental Analysis | Technical Analysis |
|---|---|---|
| Focus | Business performance | Price & chart patterns |
| Purpose | Find intrinsic value | Time entry & exit points |
| Time Horizon | Medium to long term | Short to medium term |
| Best For | Long-term investors | Active traders, swing/day traders |
🤔 Can You Trust Technical Analysis?
- ❌ It’s not a crystal ball—it can’t predict the future with certainty.
- ✅ It’s more of a probability tool: “Historically, when this pattern appeared, 70% of the time prices went up.”
Many traders find it helpful for understanding market psychology and timing trades.
✅ Key Takeaways
- Technical analysis = studying charts and price data.
- Useful for timing buy/sell decisions, especially short-term.
- Works best when combined with fundamental analysis.
- Remember: It’s about probabilities, not guarantees.
“Charts don’t predict the future, but they help you manage the odds.”
📝 Disclaimer
This article is intended for educational purposes only. It does not constitute financial, investment, or legal advice. All investment decisions involve risks, and readers should conduct their own research or consult with a licensed financial advisor.
